
There is an urban legend that has made the rounds for many years that Cape Town has many more available women than men. As part of the code4SA and Govhack #dataquest we decided to uncover the “true” story – and do the Cape Town equivalent of this engaging New York analysis – using the 2011 South African census data. The impressive wazimap site lists the total male-to-female ratio in Cape Town as almost equal at 49-51%, but lets dig deeper… To investigate more fully we broke down the census data into:
- two age groups (20-34 or 35-49) and
- into the different ward areas of Cape Town (typically consisting of a couple of suburbs) and
- into two relationship status groups: ‘single/divorced/widowed’ (which we call “single” from now on) and ‘married/living together’.
Lets start with the results averaged over all the wards of Cape Town.

Histogram of single Male-Female ratio in Cape Town wards in the “young” age group (20-34): more single men than women.

Histogram of single male-to-female ratios in Cape Town over wards: “older” age group (35-49). Significantly more single women then men.
When we crunched the 2011 numbers a clear picture emerged that was different from the average statistics. In the younger (20-34) category single men outnumber single women by 20% (1.2:1) while in the older (35-49) single category the result is reversed: single women outnumber single men by about 40% (1:1.4) on average*. Looking at the figures we see that there are wards with two single women per single man in the 35-49 category, showing that there is some truth in the urban myth, but only for the over-35’s.
How about people in relationships? Not surprisingly we found that the situation is reversed compared to the singles situation in both age categories which strongly suggests that on average young women are typically in relationships with older men – something borne out by this Code4sa analysis of marriages where most grooms are on average about three years older than their brides. On the other hand older women are in fewer relationships with younger men on average, leaving an excess of single young men and single older women. So much for the average over all of Cape Town. What happens on a ward-by-ward basis? You can see Cape Town’s wards here. How does the male-to-female ratio for single Cape Town adults in the two age groups look like? Well, here they are:

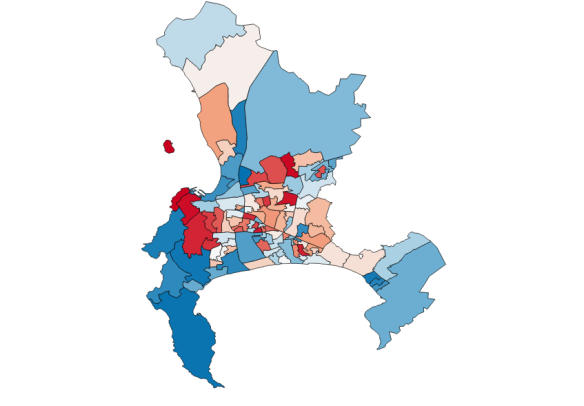
Male-Female ratio for single adults aged 35-49 by ward in Cape Town (red is low, blue is high) relative to the average of about 0.7. Note that only three wards exceed the national male-to-female average for all age-groups, which is 0.95.
Male to female ratio for single adults aged 20-34 (blue = high, red = low). Comparing to the plot above we see some regions with the same colours in both age groups (e.g. Southern suburbs) and some that have large swings (e.g. Sea Point, Chapman’s Peak). Note these are coloured relative to the median ratio of about 1.14
Some regions stand out: the Southern suburbs (Constantia, Rondebosch, Newlands, Claremont etc…) have a significantly higher number of single women across both age groups (the University of Cape Town may be a significant contributing factor) while other regions are probably affected by military bases (e.g. Simon’s Town). As in New York, there are some very curious, large, variations across neighbouring wards. But our analysis also shows something new: big swings across age. The Sea Point and Cape Town CBD areas, for example show a big swing from red (20-34) to blue (35-49) which would be interesting to unpack and understand more deeply…
So in summary, the urban myth is not all wrong – there really are some significant variations in the single male-to-female ratio across Cape Town and across time, despite the average male-to-female ratio being nearly 50-50. For those interested, here are the hottest spots with their Male-to-Female ratios in brackets:
- Highest single male-to-female ratio (20-34): Edgemead & Bothasig (2.39:1)
- Lowest single male-to-female ratio (20-34): Sea Point, Clifton & Green Point (0.91:1)
- Highest single male-to-female ratio (35-49): Simon’s Town & Scarborough (1.37:1)
- Lowest single male-to-female ratio (35-49): Durbanville (0.45:1)
Thanks to my team members: Jason, Delaney, Michael Graaf (@michaelgraaf) & Franck and to code4sa and govhack for a great event. Footnotes: * Note that here “average” is over wards, not over the population (i.e. a ward with 40,000 people will have the same statistical weight on the average as a ward with 100,000 people). ** There is a small, but non-zero chance that we got the statistics wrong: we did hack everything together in one morning so don’t buy a new house based on this work!

Did the Census data include sexual preference? – I would think there is a higher percentage of gay males living in certain areas that gay females.
Our analysis included all sexual preferences. We did not distinguish between sexual preferences so we cannot really comment.
I was just about to ask the same question. I reckon at least 30% of young single males are gay in CT. Go out on a Friday night to a restaurant (say in Greenpoint) – There are some places that in a room of 80 people, there will be around 5 women
Like this. Will reblog it on our Dating Blog soon: https://rinsebeforeuse.wordpress.com/2015/05/21/life-in-the-friend-zone/